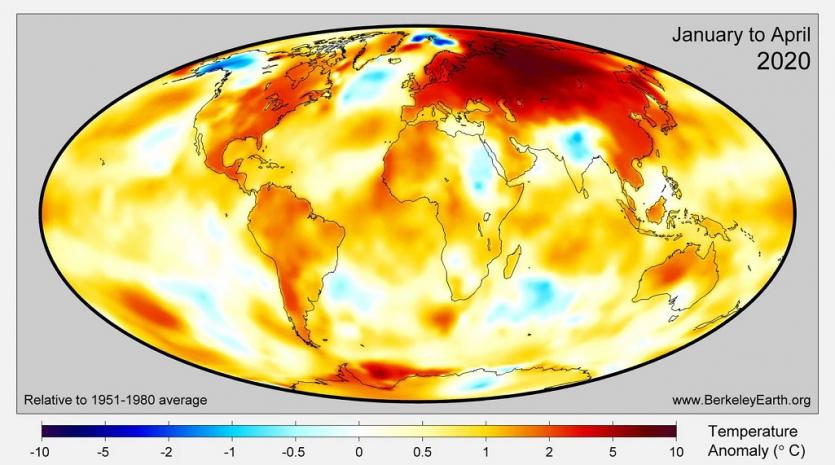
January to April temperature departures from average, showing the most significant temperature anomalies across Russia, including Siberia. (Berkeley Earth)
Huge deviations from the norm, Siberia becomes a red spot on the world map
The World Daily | News Desk | MAY 28th 2020
There are many indications that this summer in Siberia will be extremely hot. In recent months, the region has been particularly warm, as can be seen on the maps prepared by the National Oceanic and Meteorological Service (NOAA). Even beyond the Arctic Circle, the temperature exceeded 25 degrees Celsius.
On Friday, May 22, a temperature of 25.4 degrees Celsius was recorded in the Siberian village of Chatanga on the Tajmyr peninsula north of the Arctic Circle. Usually the maximum temperature on this day is 0 degrees. For comparison - the highest temperature ever recorded there on May 22 was 12 degrees C. In the following days, the temperature gradually dropped. On Wednesday, May 27, maximum 14 degrees have already been recorded.
Record warmth was also noted in the middle of May in the city of Surgut. Thermometers there showed 28 degrees Celsius. It is 10 degrees higher than the norm. “The heat wave reached us from the southwest, almost from Iran,” said a professor quoted by "Siberian Times", Alexei Kozuchowski from the Faculty of Geography of Siberian Federal University.
It is still warm, even hot, in much of Russia. In Yakutsk, which is associated with cold, thermometers showed 27 degrees Celsius on Wednesday. The record number for May in this place is 31 degrees. On average, however, it is around 13 degrees in May.
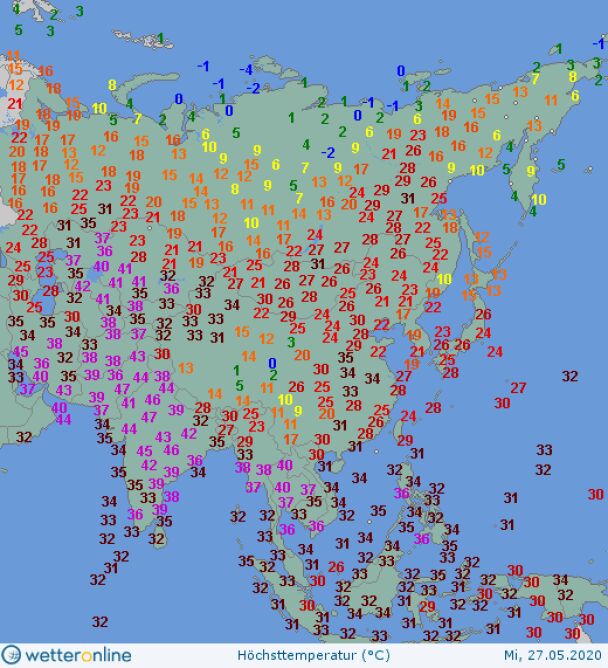
Maximum temperature May 27 (wetteronline.de)
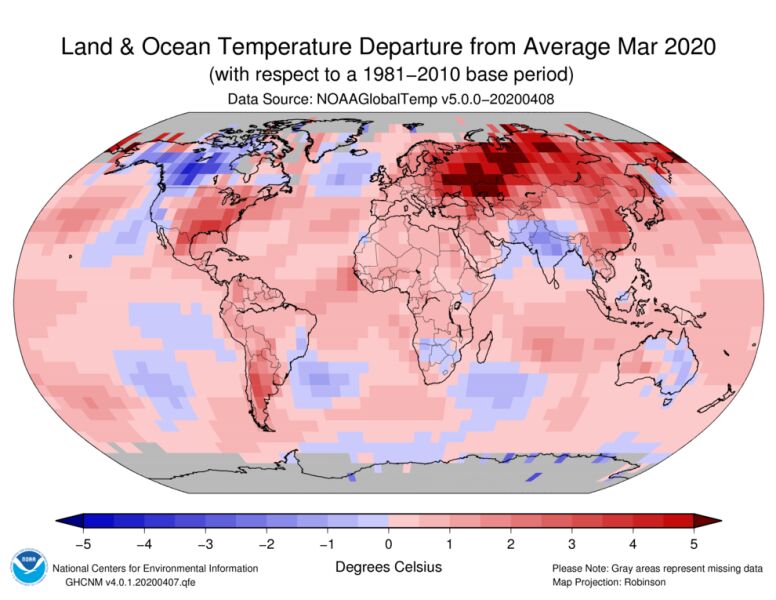
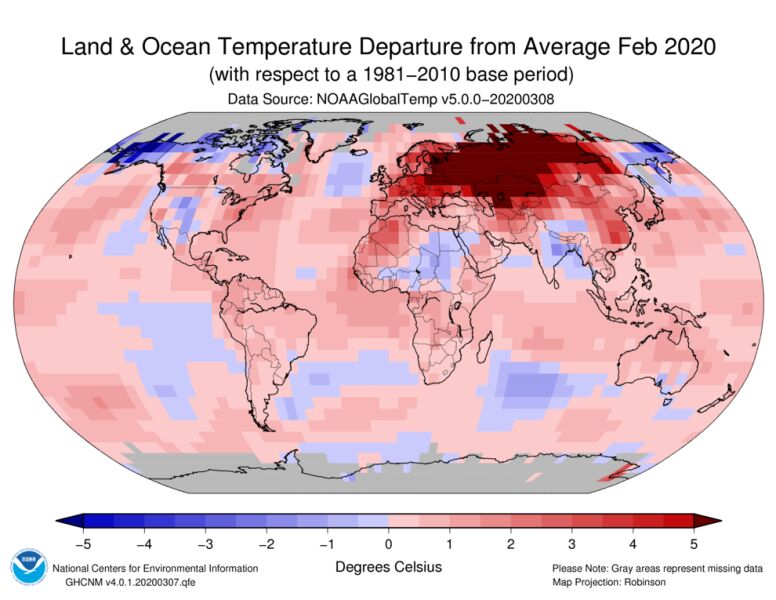
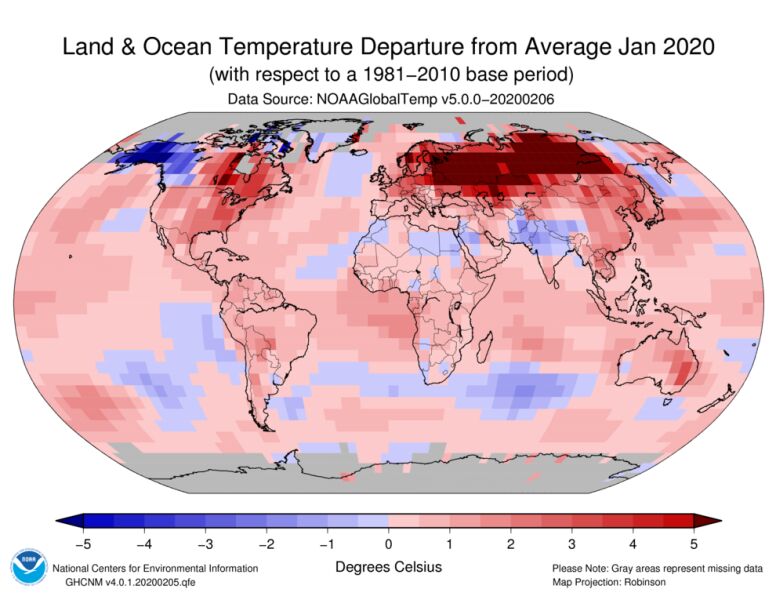
Such warmth in Siberia in May is not something that happened suddenly. Lasts for several months. This is clearly seen in the global maps with a deviation from the average temperature of lands and oceans, which are prepared by the National Oceanic and Meteorological Service (NOAA).
This extreme deviation is marked by magenta red. The April map shows that the deviation from the norm exceeded +5 degrees in this region. It is similar on maps from previous months.
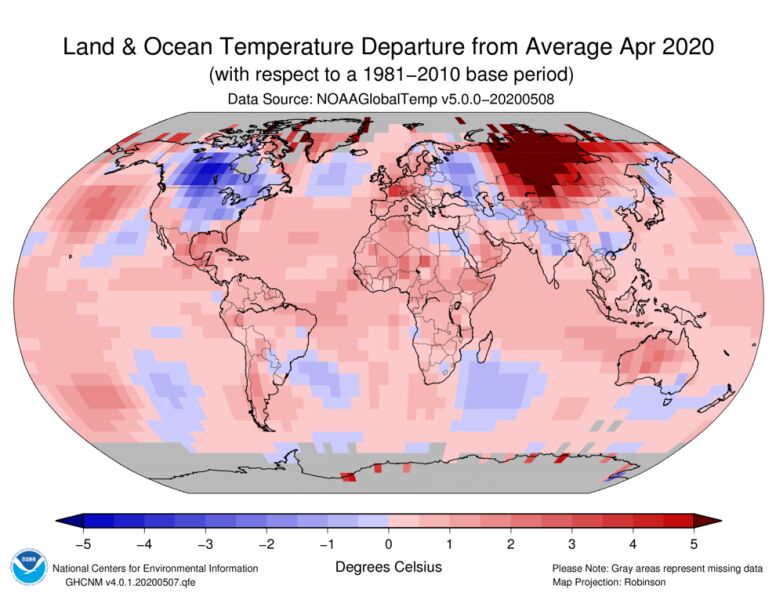
Deviation of the average land and ocean temperature in April 2020 from the standard from 1981-2011 (NOAA)
According to Robert Rohde, who is a member of the non-governmental organization Berkeley Earth, dealing with the analysis of climate change, in Russia from January to April 2020 the average temperature anomaly from the long-term average has reached almost 6 degrees.
“That’s not only a new record anomaly for Russia,” he wrote via Twitter. “That’s the largest January to April anomaly ever seen in any country’s national average.”
If 2020 ends up as a new record warm year, and it might, then a significant component of that will have been the incredibly warm start of the year that has just occurred in Asia.
— Robert Rohde (@RARohde) May 19, 2020
The heat in this region already has its negative consequences for the Arctic ecosystem: a large number of fires and extremely rapidly decreasing snow and ice cover in the Karski Sea region. They are at record lows, and their seasonal melting began more than a month earlier than it usually happens.
Zack Labe, a graduate of the University of California in Irvine, who studies the dependence of climate change in the Arctic region, posted a Twitter post with a graph. Purple lines mark the beginning of melting in 1980, and red lines - in 2020.
Striking to compare the timing differences in the start of the summer melt season in the Kara Sea - for instance, look at 2020 (red line) relative to the 1980s (purple lines) pic.twitter.com/9XkWTLONZQ
— Zack Labe (@ZLabe) May 20, 2020
This year, fires in Siberia started quickly and expansively. Russian officials expect this summer may be the hottest in history and the fires can be extremely devastating. Last year, over 2.8 million hectares of land were burned, and this year over 607 thousand hectares so far.
The map below presents the fires observed in the last 24 hours:
© The World Daily 2020 | News Desk